In the hustling world with the bustling people, Yahoo presented the all-new data-driven tool, Flurry Analytics, which is booming among the app developers to track the aggregate data of the app users. It is similar to the Google Analytics used for the websites. You can use Flurry Analytics to measure and analyze the activities of mobile users’ as well as engagement and behavior.
Flurry Analytics is the old portal, which is recently showcasing its popularity with complete functionality, high-end features and helpful in finding the metrics of the app users. At present, Flurry Analytics is tracking more smartphone users than the search engines and the social networks.
You can use Flurry Analytics for both iOS and Android. Among the other analytics tool, Flurry provides the critical data, allowing you to better understand the issues and provide the best solution for the user’s problem.
Major Benefits Using Flurry Analytics
- Ability to track multiple apps simultaneously
- Easy to compare iOS versus Android in-app purchases
- Can generate advanced reports for complex analysis
- Can customize the app groups for easy access and viewing
- Creates a deep understanding about user’s interest and their intent.
What are the main features that are available in Flurry Analytics?
The platform provides the main features,
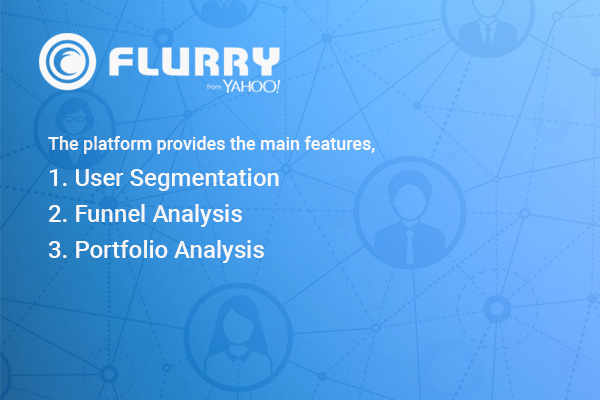
1. User Segmentation
You can categorize the user segments as such paying users versus non-paying users and light users versus heavy users, active users and their genders.
2. Funnel Analysis
You can discover how your customers/users are progressing through the specific path, the consumer conversions, and the other trending metrics.
3. Portfolio Analysis
Useful for the organization to manage the entire portfolio of the mobile applications. It monitors the data that overlap application and as well as track the up-selling and cross-selling conversions.
Uniqueness of FLURRY
(a) Crash Analytics
You could analyze the error and their crashes through app version and firmware. This is one of the critical problems that Flurry Analytics solves.
(b) Data Benchmark
View them according to the benchmark category to discover your app performing.
(c) Demographic Analytics
Can estimate the accurate user’s active age and gender to understand the segments of the user.
(d) Free of cost
You can track the user data for completely free with no data limits.
(e) Analytics of user acquisition
You can analyze and monitor user acquisition by measuring the performance and effort of a specific campaign.
Flock to Flurry Analysis,
If you haven’t guessed already, what is happening with the app analytics, here is the short review from the pops.
According to Forbes,
Meet the company’s app analytics and their accesses
According to Simon Khalaf, SVP, the senior vice president of Product & Engineering for publisher products in Yahoo states,
The Flurry footprint over the previous years.
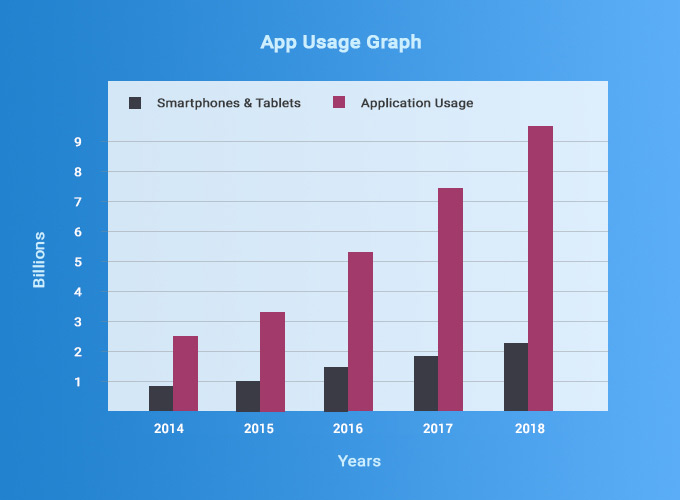
Statistical Data on Mobile and App Usage
Mobile app loyalty program
Mobile app users are increasing drastically. The effective and efficient mobile apps always engage users in spending more time and frequency of usage. Every business owner gets benefited through these app loyalty programs
For instance, you go to a subway outlet and get 2 burgers, the same order you place it you get 1 free out of it. Through these effective apps, business owners acquire plenty of new customers, and users will never neglect the apps while there would be an increase in the frequency. Thus, proven to be app loyalty.
App Loyalty Matrix
According to the mobile app loyalty program Flurry introduced the app loyalty matrix before a decade, which took an in-depth understanding of customer loyalty based on app category. Today, flurry again plots the app category through the matrix.
-
- The frequency of days plotted on the x-axis
- The frequency of use per week plotted on the y-axis
How do I import data from the Flurry Analytics?
You need two token to Import data from the Flurry Analytics.
- Flurry API access code
- Flurry API key.
Create your own Flurry account, and optimize your app to produce a great deal of profit,
After your app designed, developed and deployed, don’t you feel passionate about your app’s functioning, user’s engagement, and session duration?
Try the Flurry Analytics and monitor your app and optimize to improve its efficiency.